About
Bellabeat is a high-tech manufacturer of health-focused products for women. Bellabeat is a successful small company, but they have the potential to become a larger player in the global smart device market.
Urška Sršen, cofounder and Chief Creative Officer of Bellabeat, believes that analyzing smart device fitness data could help unlock new growth opportunities for the company.
I have been asked to focus on one of Bellabeat's products and analyze smart device data to gain insight into how consumers are using their smart devices. The insights I discover will then help guide marketing strategy for the company. My analysis will be presented to the Bellabeat executive team along with my high-level recommendations for Bellabeat's marketing strategy.
Bellabeat Products
- Bellabeat app: The Bellabeat app provides users with health data related to their activity, sleep, stress, menstrual cycle, and mindfulness habits. This data can help users better understand their current habits and make healthy decisions. The Bellabeat app connects to their line of smart wellness products
- Leaf: Bellabeat's classic wellness tracker can be worn as a bracelet, necklace, or clip. The Leaf tracker connects to the Bellabeat app to track activity, sleep, and stress
- Time: This wellness watch combines the timeless look of a classic timepiece with smart technology to track user activity, sleep, and stress. The Time watch connects to the Bellabeat app to provide you with insights into your daily wellness
- Spring: This is a water bottle that tracks daily water intake using smart technology to ensure that you are appropriately hydrated throughout the day. The Spring bottle connects to the Bellabeat app to track your hydration levels
Ask
Sršen knows that an analysis of Bellabeat's available consumer data would reveal more opportunities for growth. She has asked the marketing analytics team to focus on a Bellabeat product and analyze smart device usage data in order to gain insight into how people are already using their smart devices. Then, using this information, she would like high-level recommendations for how these trends can inform Bellabeat marketing strategy.
Sršen asked me to analyze smart device usage data in order to gain insight into how consumers use non-Bellabeat smart devices. She then wants me to select one Bellabeat product to apply these insights to in my presentation.
Questions to guide my analysis
- What are some trends in smart device usage?
- How could these trends apply to Bellabeat customers?
- How could these trends help influence Bellabeat marketing strategy?
A clear summary of the business task
- Analyze smart device usage data in order to gain insight into how consumers use non-Bellabeat smart devices
- How can analysis of user data from other smart device users give insight to how people are using their smart devices
- How can this analysis help Bellabeat unlock new growth opportunities for the company
- How the analytic trends can assist the marketing strategy for the company
Prepare
A description of all data sources used
The data is from a Kaggke dataset made available by Mobius. The dataset, Fitbit Fitness Tracker Data, is under CCO: Public Domain licensing therefore there is no copyright issues.
The dataset contains the personal fitness tracker data from thirty fitbit users and track physical activity, heart rate, and sleep monitoring. It includes information about daily activity, steps, calories burnt and heart rate data.
The dataset was generated form a distributed survey via Amazon Mechanical Turk and contains 18 csv files in long format tracking fitbit data from 03/12/2016 - 05/12/2016.
Of the 18 csv files I have decided to focus on 8 of the datasets for analysis
- dailyActivty_merged.csv
- dailyIntensities_merged.csv
- dailySleep_merged.csv
- dailySteps_merged.csv
- dailyCalories_merged.csv
- hourlyCalories_merged.csv
- hourlySteps_merged.csv
- hourlyIntensities_merged.csv
Process
I opened the datasets in Microsoft Excel to process the data
I checked data for consistencies (number of respondents)
- dailyActivty_merged.csv - 33 respondents
- dailyIntensities_merged.csv - 33 respondents
- dailySleep_merged.csv - 24 respondents
- dailySteps_merged.csv - 33 respondents
- dailyCalories_merged.csv - 33 respondents
- hourlyCalories_merged.csv - 33 respondents
- hourlySteps_merged.csv - 33 respondents
- hourlyIntensities_merged.csv - 33 respondents
I found the number of respondents were inconsistant with the 30 I was expecting based on the description of the original survey. 7 of the datasets I am using for analysis had 33 unique id's and one dataset had 24 unique id's
I used conditional formatting to search for dulicates
- daily_sleep.csv - 3 duplicates
I deleted the duplicates and saved the dataset
I re-formatted all the ActivityData columns as some were formatted wrong. I seperated the time into a seperate column from ActivityDate and changed the time to a 24 hour time notation and removed the am/pm notation
Once the datasets were clean, I imported the datasets in BigQuery for further analysis and renamed the datasets during the impoort
- dailyActivty_merged.csv - daily_activity
- dailyIntensities_merged.csv - daily_intensities
- dailySleep_merged.csv - daily_sleep
- dailySteps_merged.csv - daily_steps
- dailyCalories_merged.csv - daily_calories
- hourlyCalories_merged.csv - hourly_calories
- hourlySteps_merged.csv - hourly_steps
- hourlyIntensities_merged.csv - hourly_intensities
Analyze
I imported the datasets into Googles Big Query
I ran the following queries in Big Query. The queries can be found on Github.
- Verified count of each datasets
- Compaired usage by intensities
- Compaired the sum and average activity (intensity min), steps, calories by day of week
- Compaired the sum and average activity (intensity min), steps, calories by time of day
- Compaired intensities vs calories burnt
- Compaired steps vs calories burnt
- Compaired sleep, time asleep vs time in bed, average time to fall asleep
- Compaired intensities vs sleep (time asleep and time to fall asleep)
- Compaired calories vs sleep (time asleep and time to fall asleep)
Share
User Activity
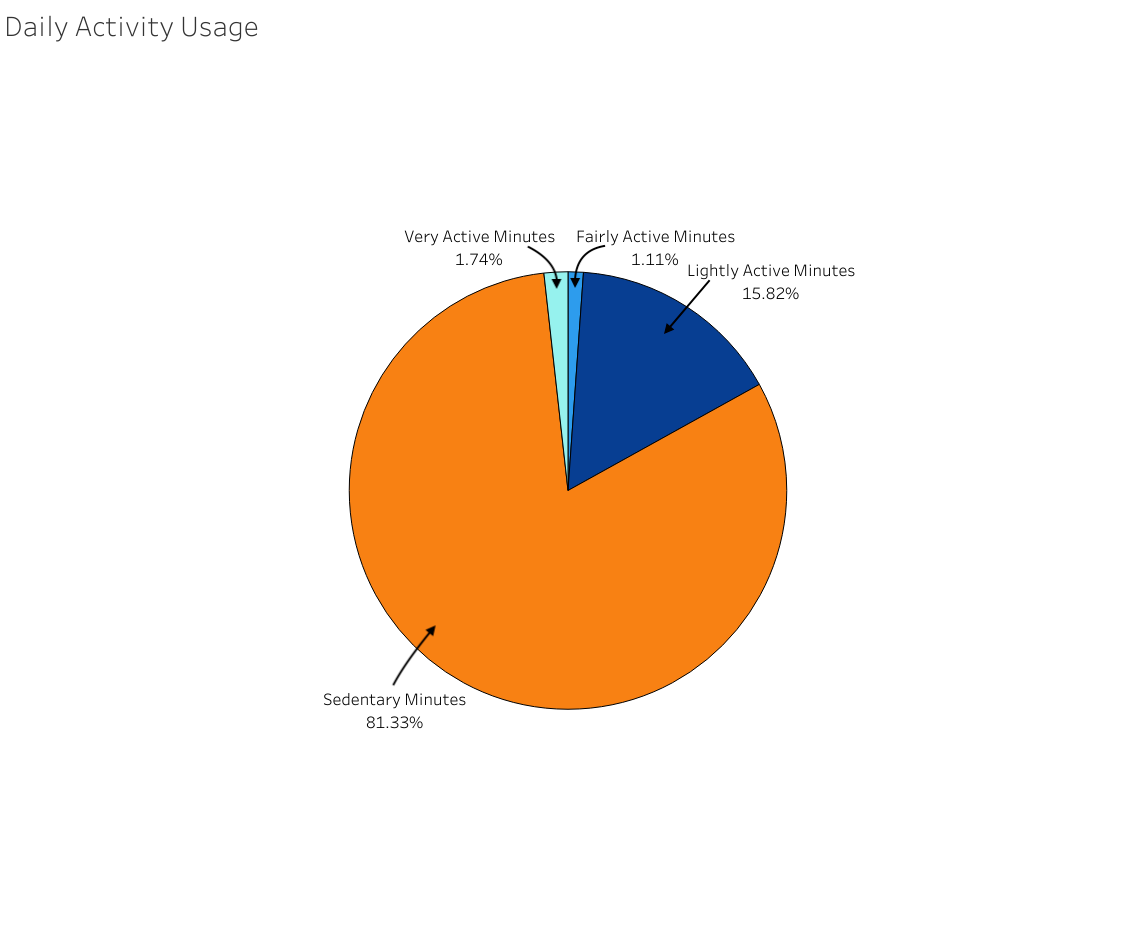
A comparison of the user Id's and activity shows that sedentary minutes make up most of the device activity by users at around of 80% of activity. In removing sedentary minutes you can get a better view activity by users. A large percent of activity is lightly active minutes. Very active minutes and faily active minutes make up around 15% of the activity minutes.
I believe this would be a consistant representation of those who wear their device while sleeping and have jobs where they may do a lot of sitting throughout the day. The lower activity minutes, sedentary and lightly active minutes, could represent in bed or sitting minutes where the higher activity level minutes could represent walking or mild to hight levels of exercise.
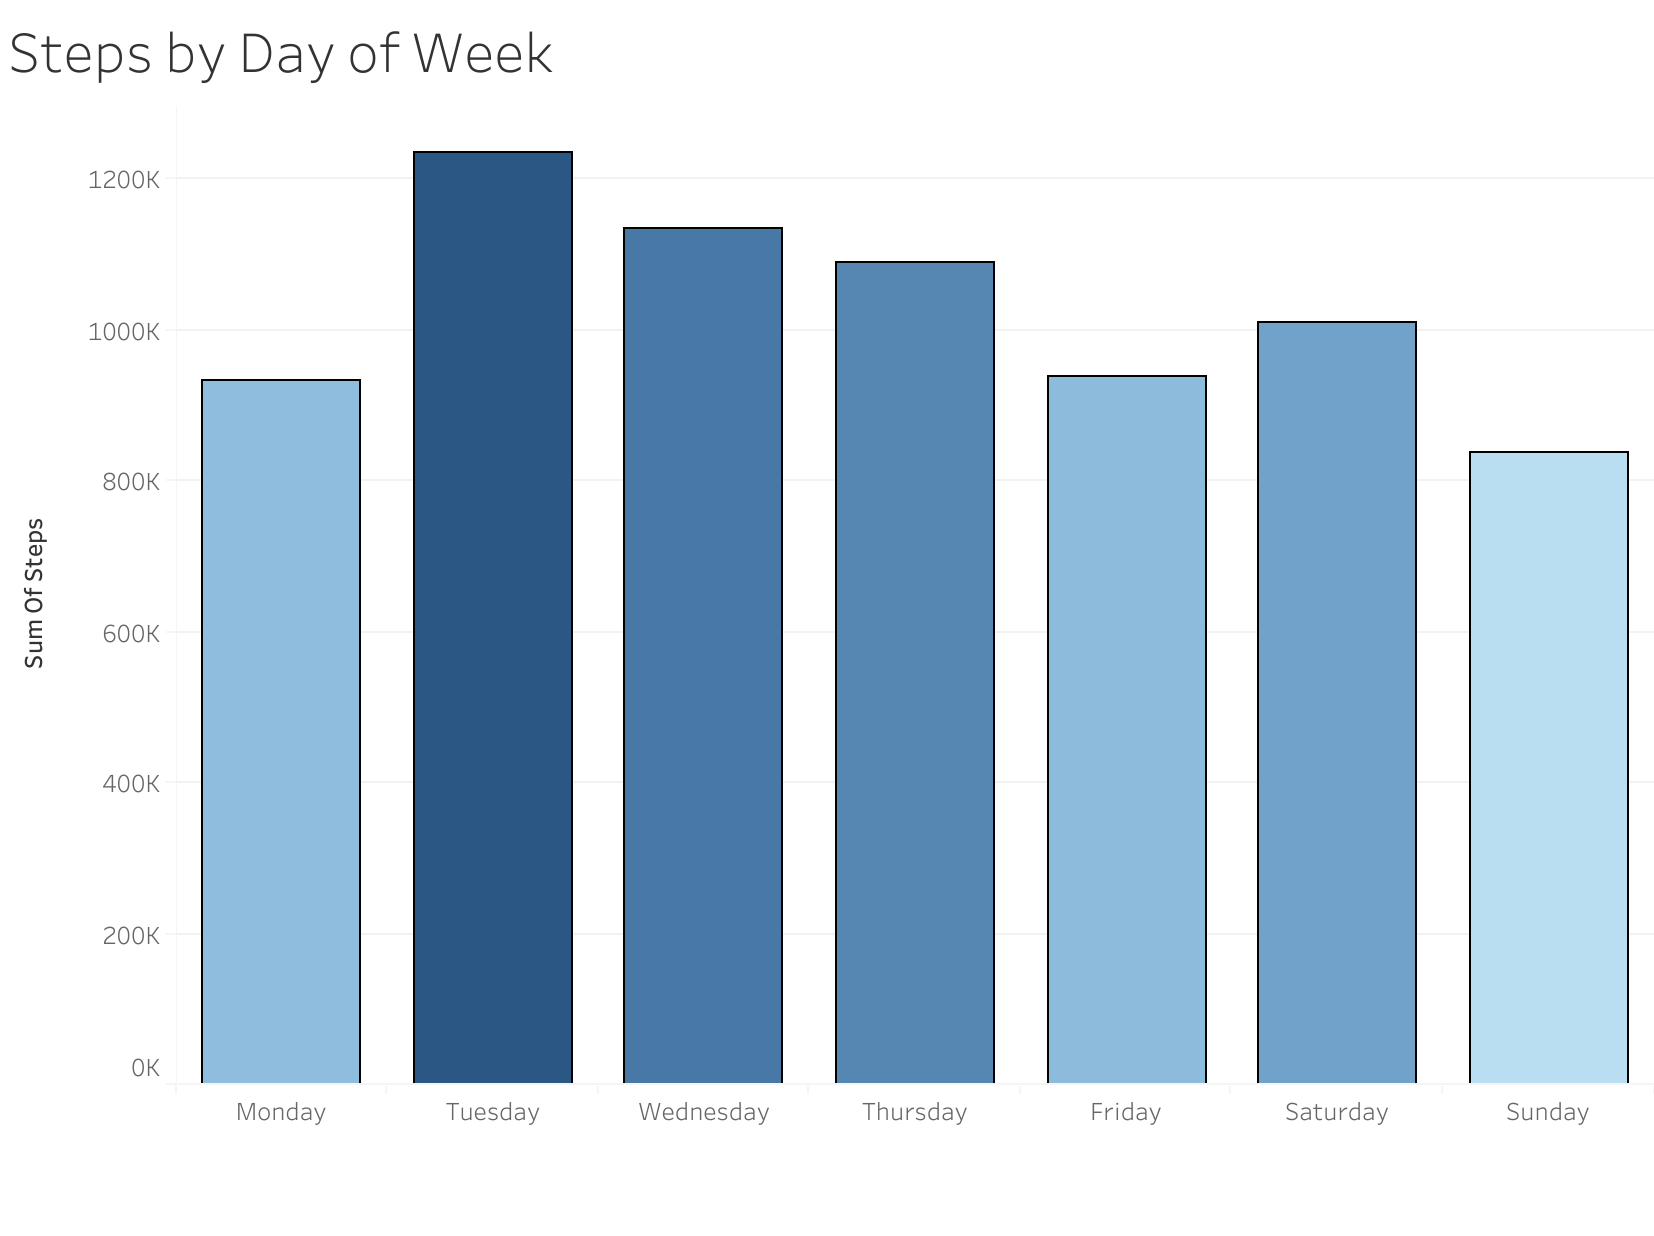
Steps by Day of Week and Calories Burnt by Day of Week
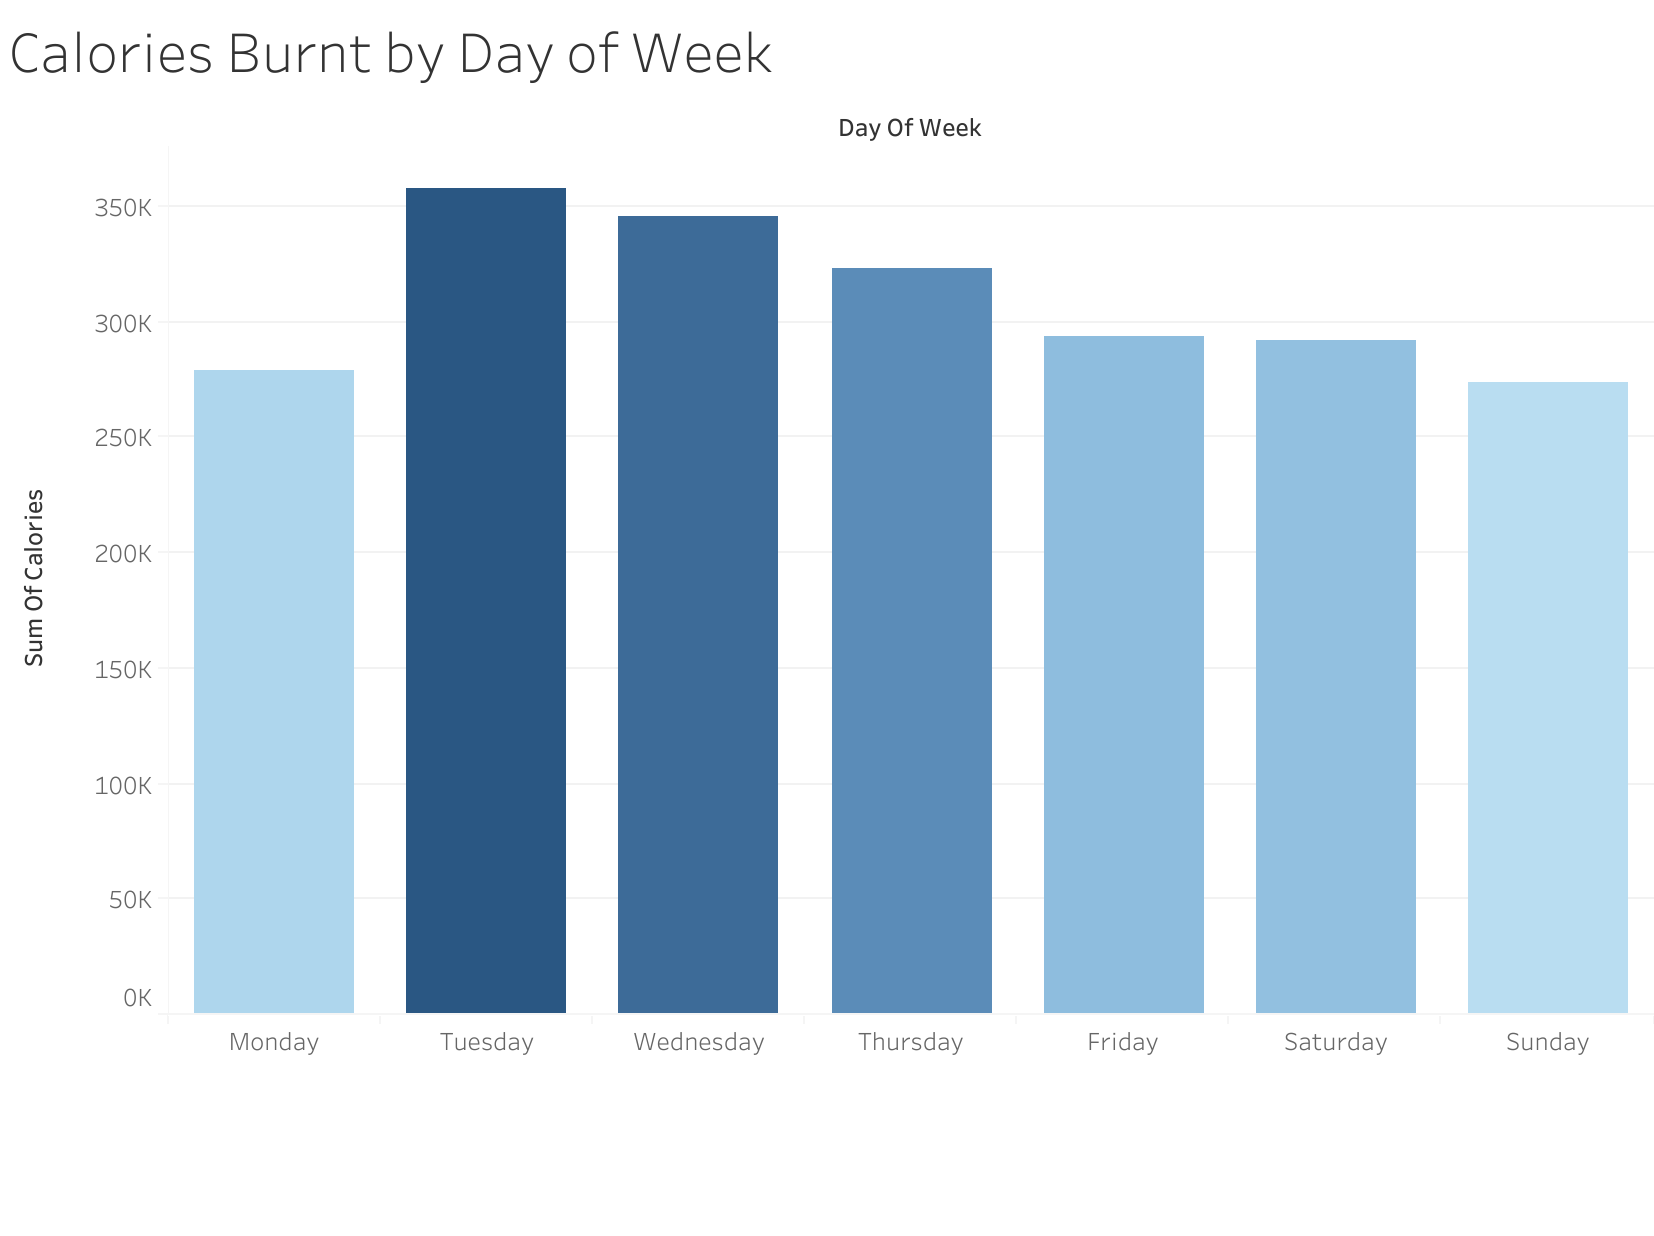
Looking at the tables, steps by day of week and the calories burnt by day of week, there is a visable correlation between the amount of steps per day and the amount of calories burnt per day. It is clear by looking at both tables, Tuesday, Wednesday, and Thursday have higher steps and calories burnt than other days of the week. It is also clear that Sundays have the lowest steps and calories burnt.
Steps by Time of Day and Calories Burnt by Time of Day
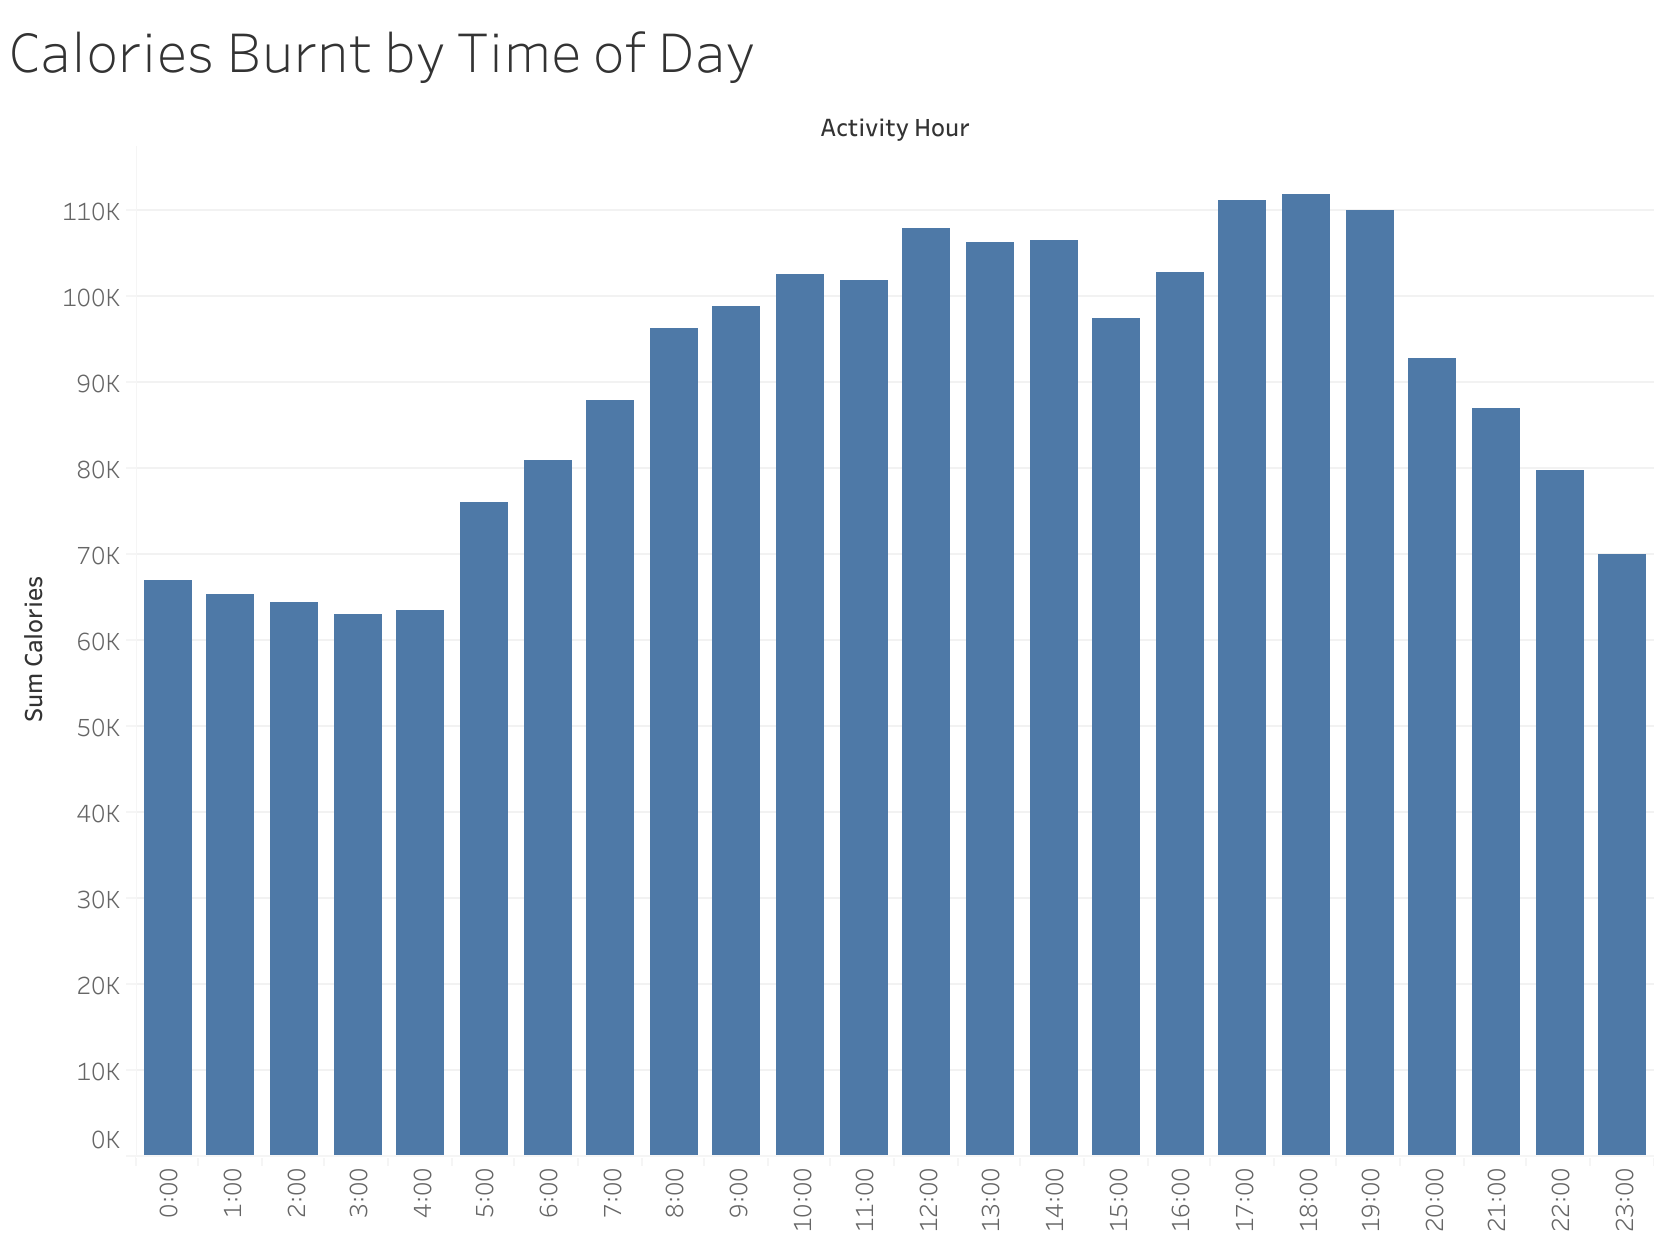
As we view steps by time of day we can see the same correlation as we did when viewing steps by day of week and calories burnt by day of week. As steps go up during the day so do calories burnt.
Steps start to increse around 6:00am and 7:00am and remain high until they trend down around 8:00pm. The highest steps are during the day is between 5:00pm and 7:00pm. This could represent after work activities such as sports, a visit to the gym, or playing with the family.
Calories burn thorughout the day, however you can see an increase in calories burnt around 5:00am and 6:00am and they remain high through the day until they trend down around 8:00pm. Calories burnt is at its peak between 5:00pm and 7:00pm which is also consistant with the peak steps around the same time

Activity on Weekdays and Activity on Weekends
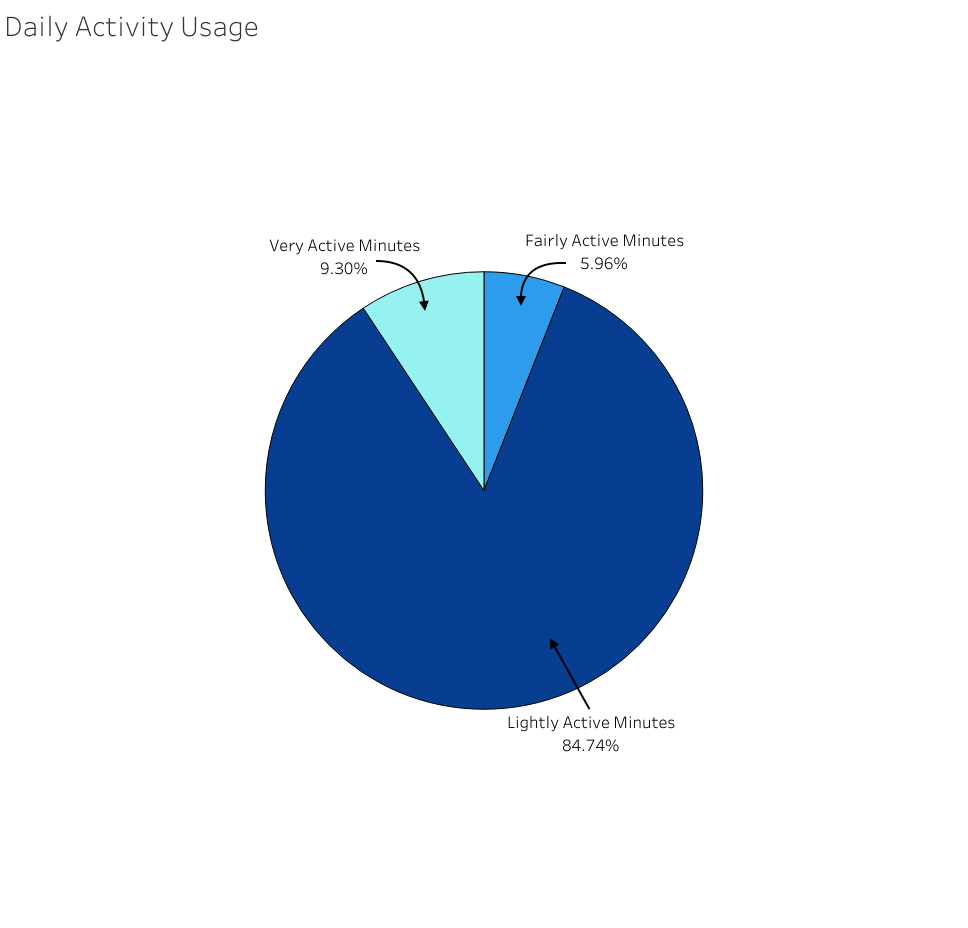
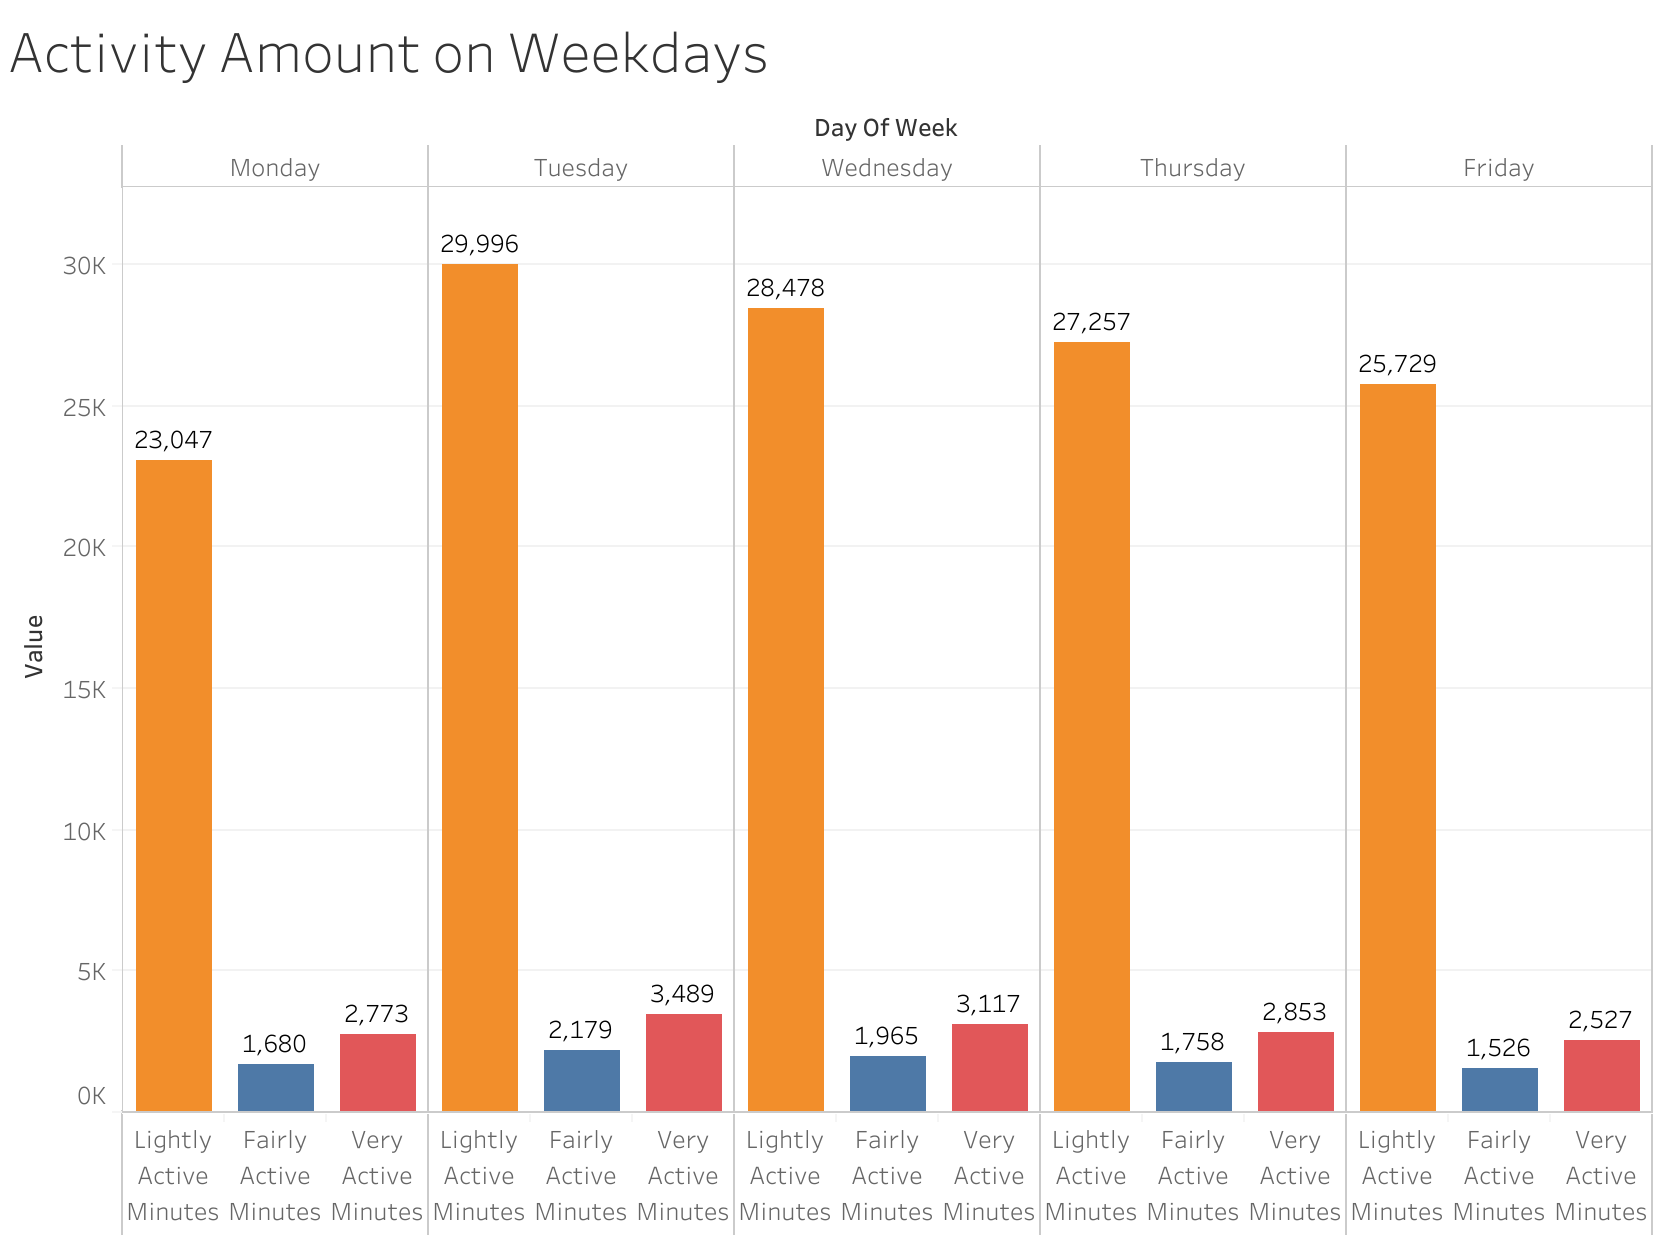
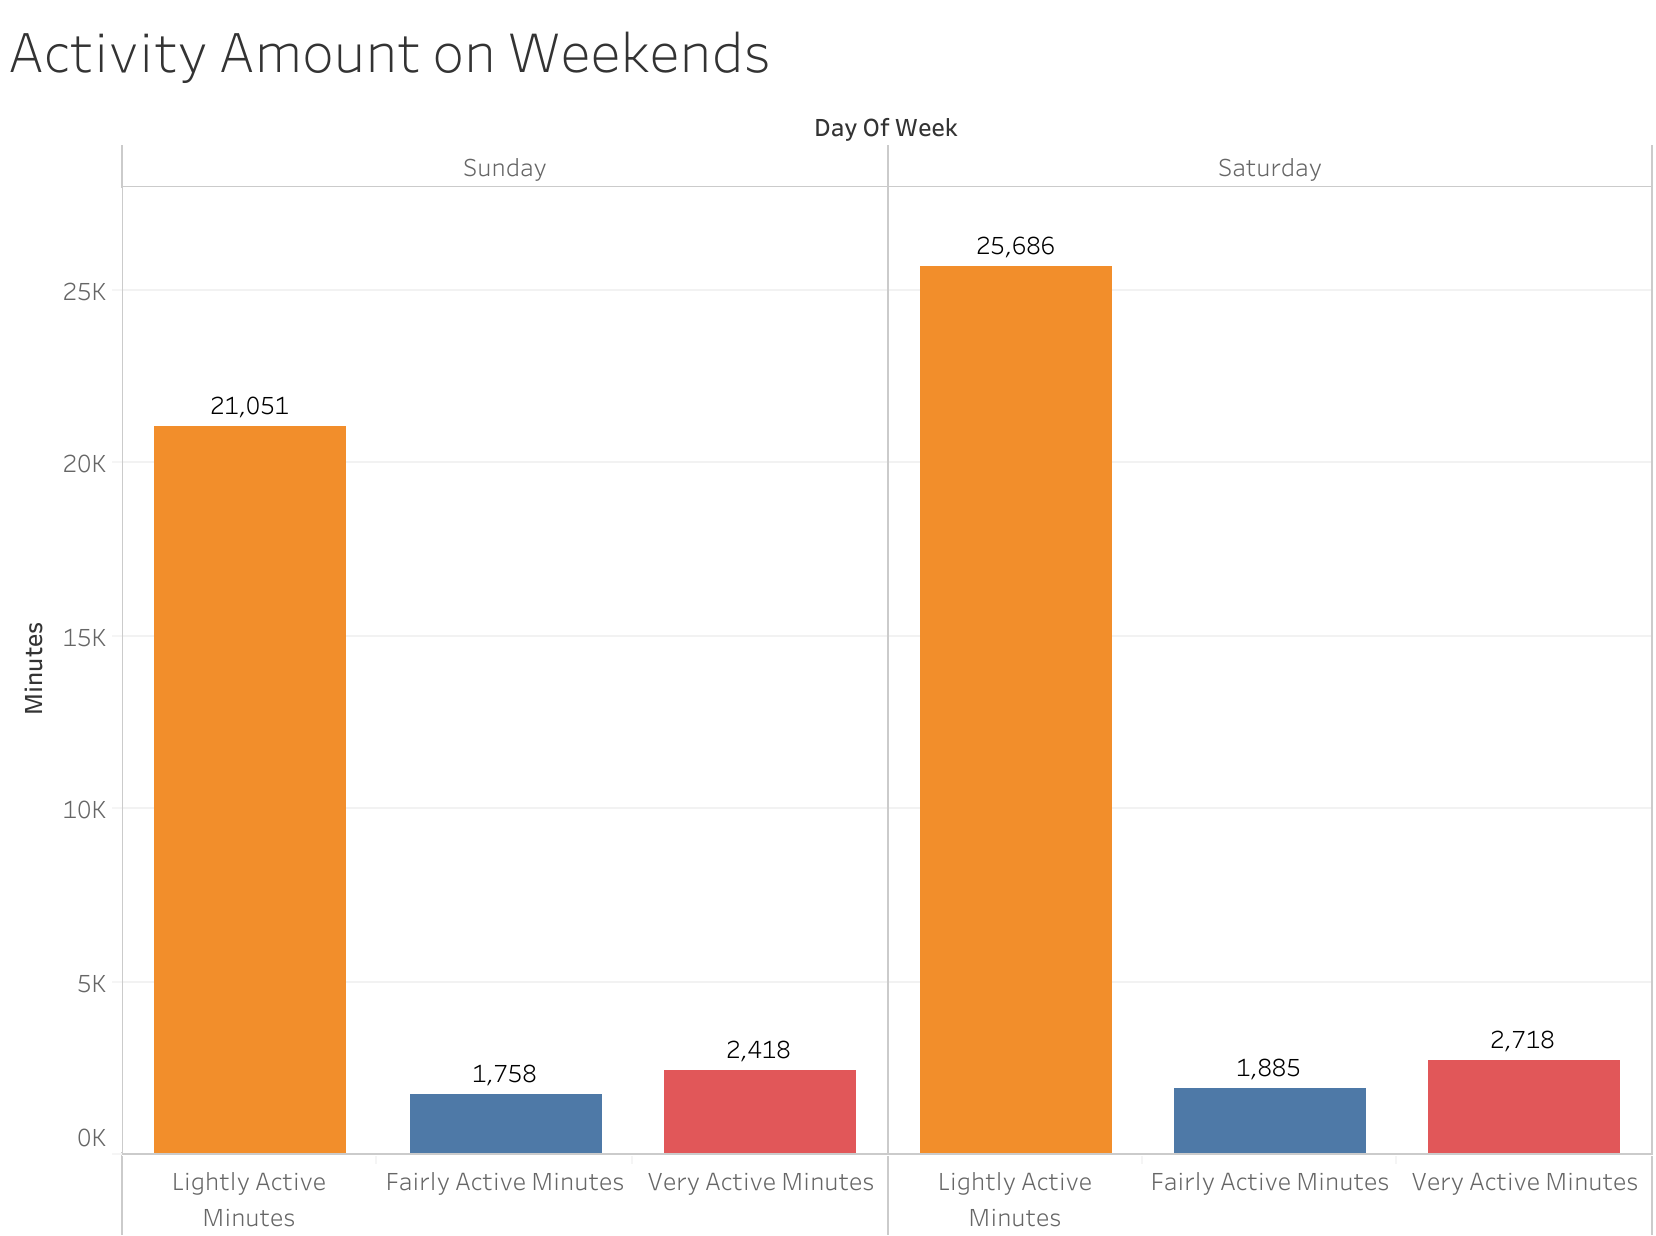
Its apparent here that lightly active minutes make up the majority of activity minutes 7 days a week. The weekends also have lower activity minutes when compaired to the activity minutes during the week. Monday - Thursday have higher activity levels when compaired to the other days of the week.
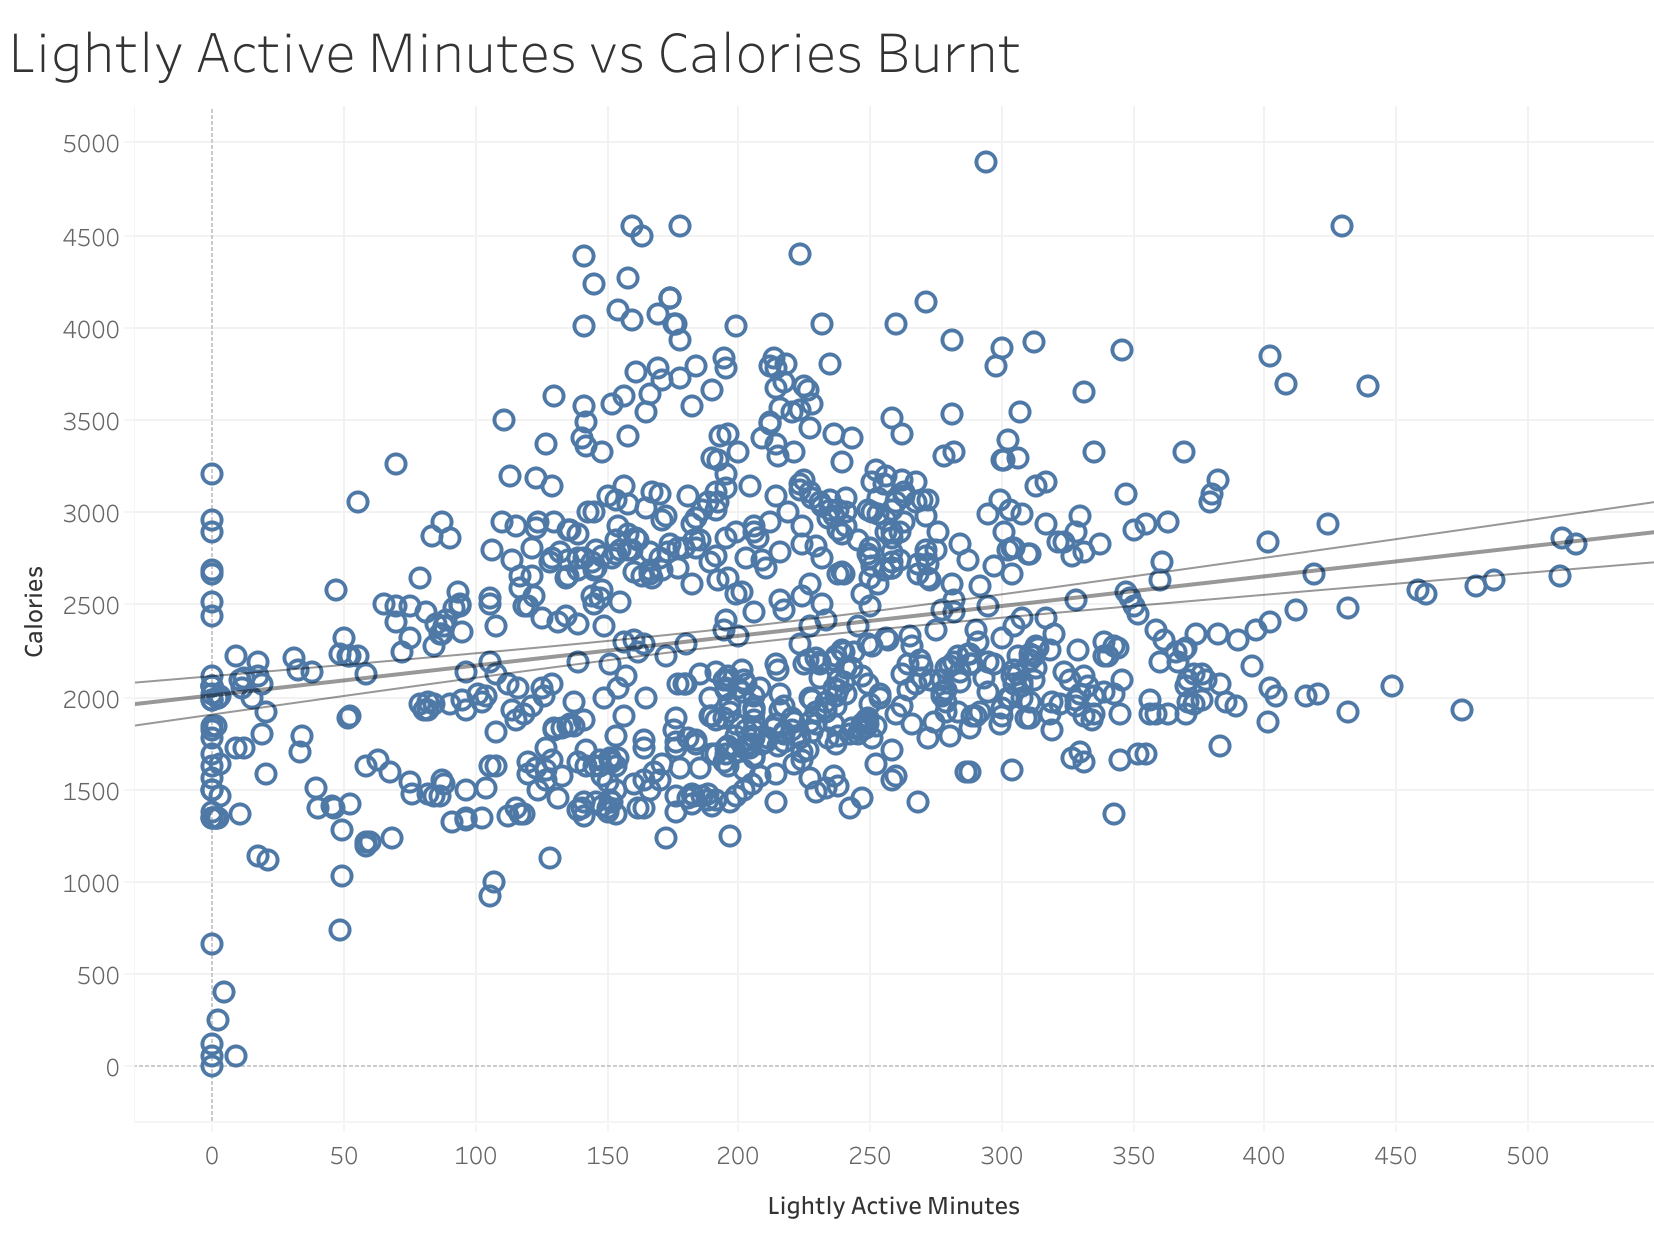
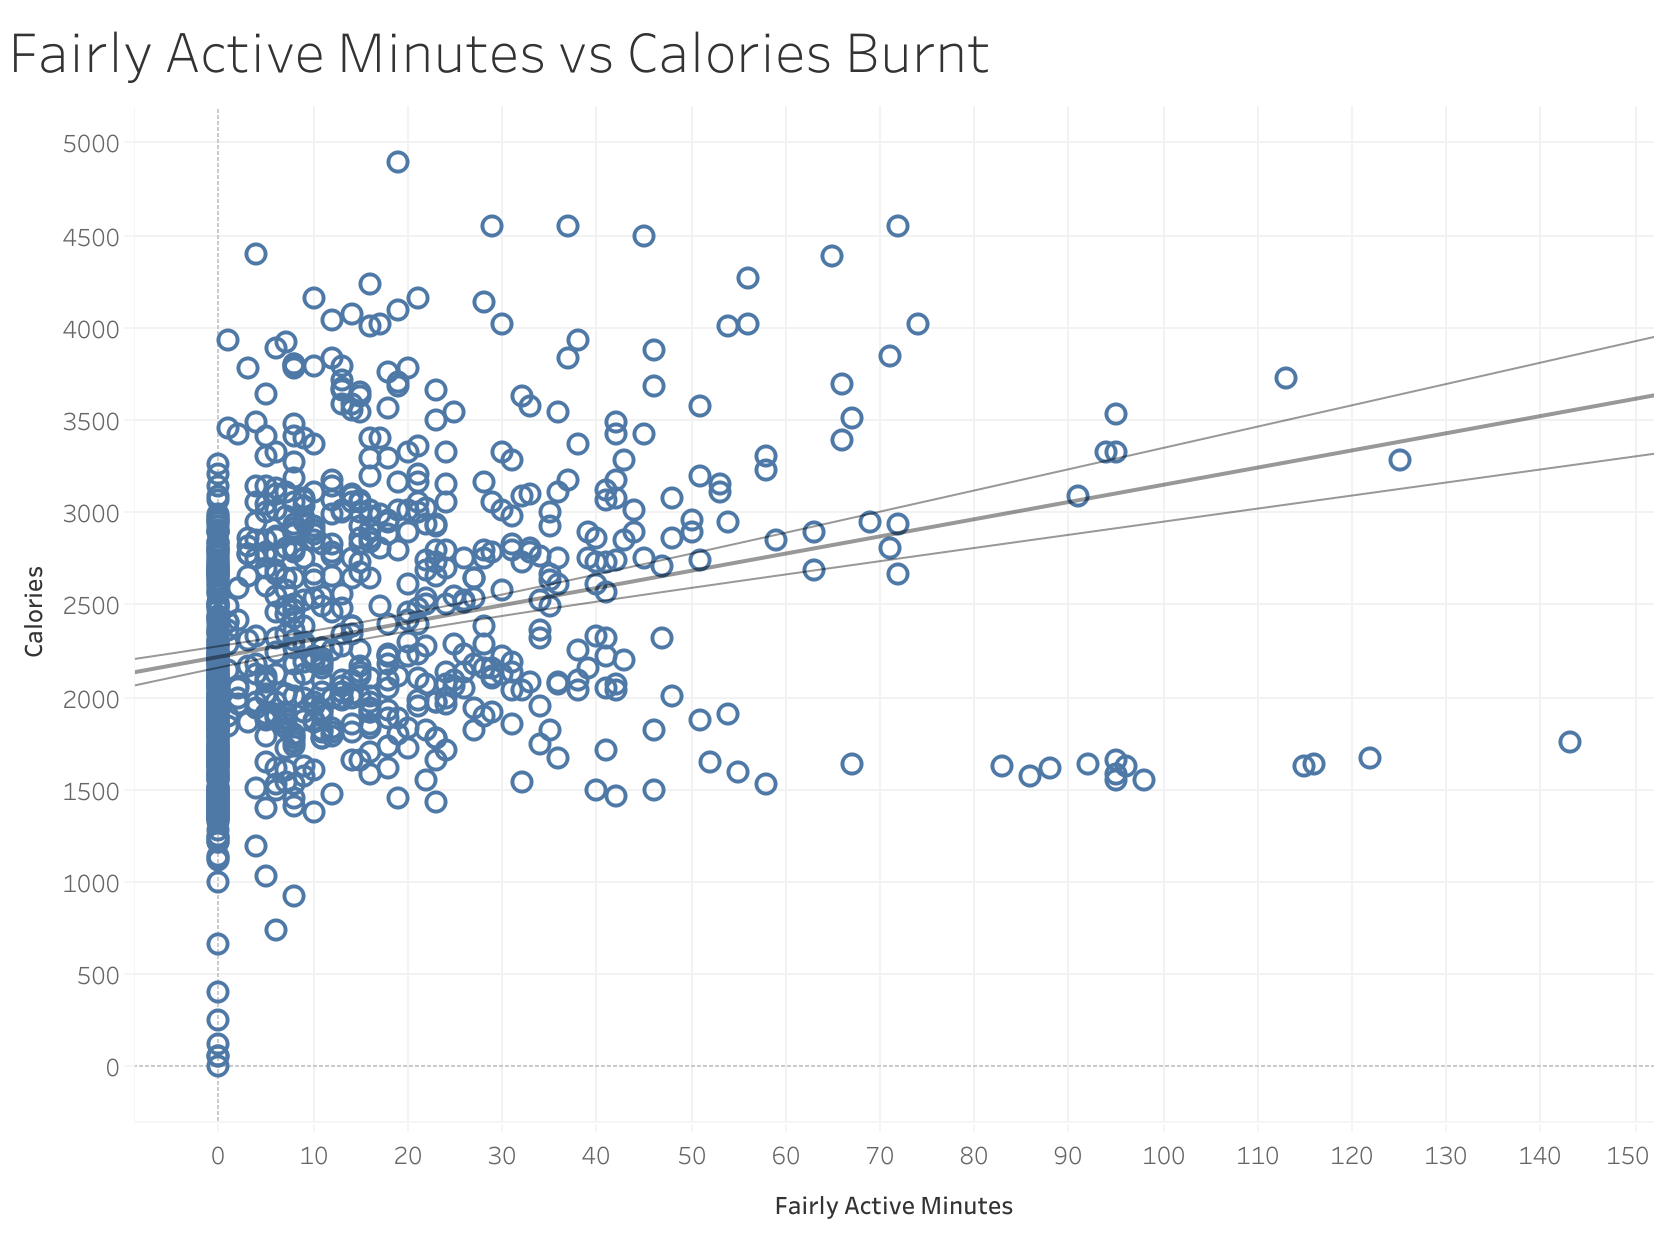
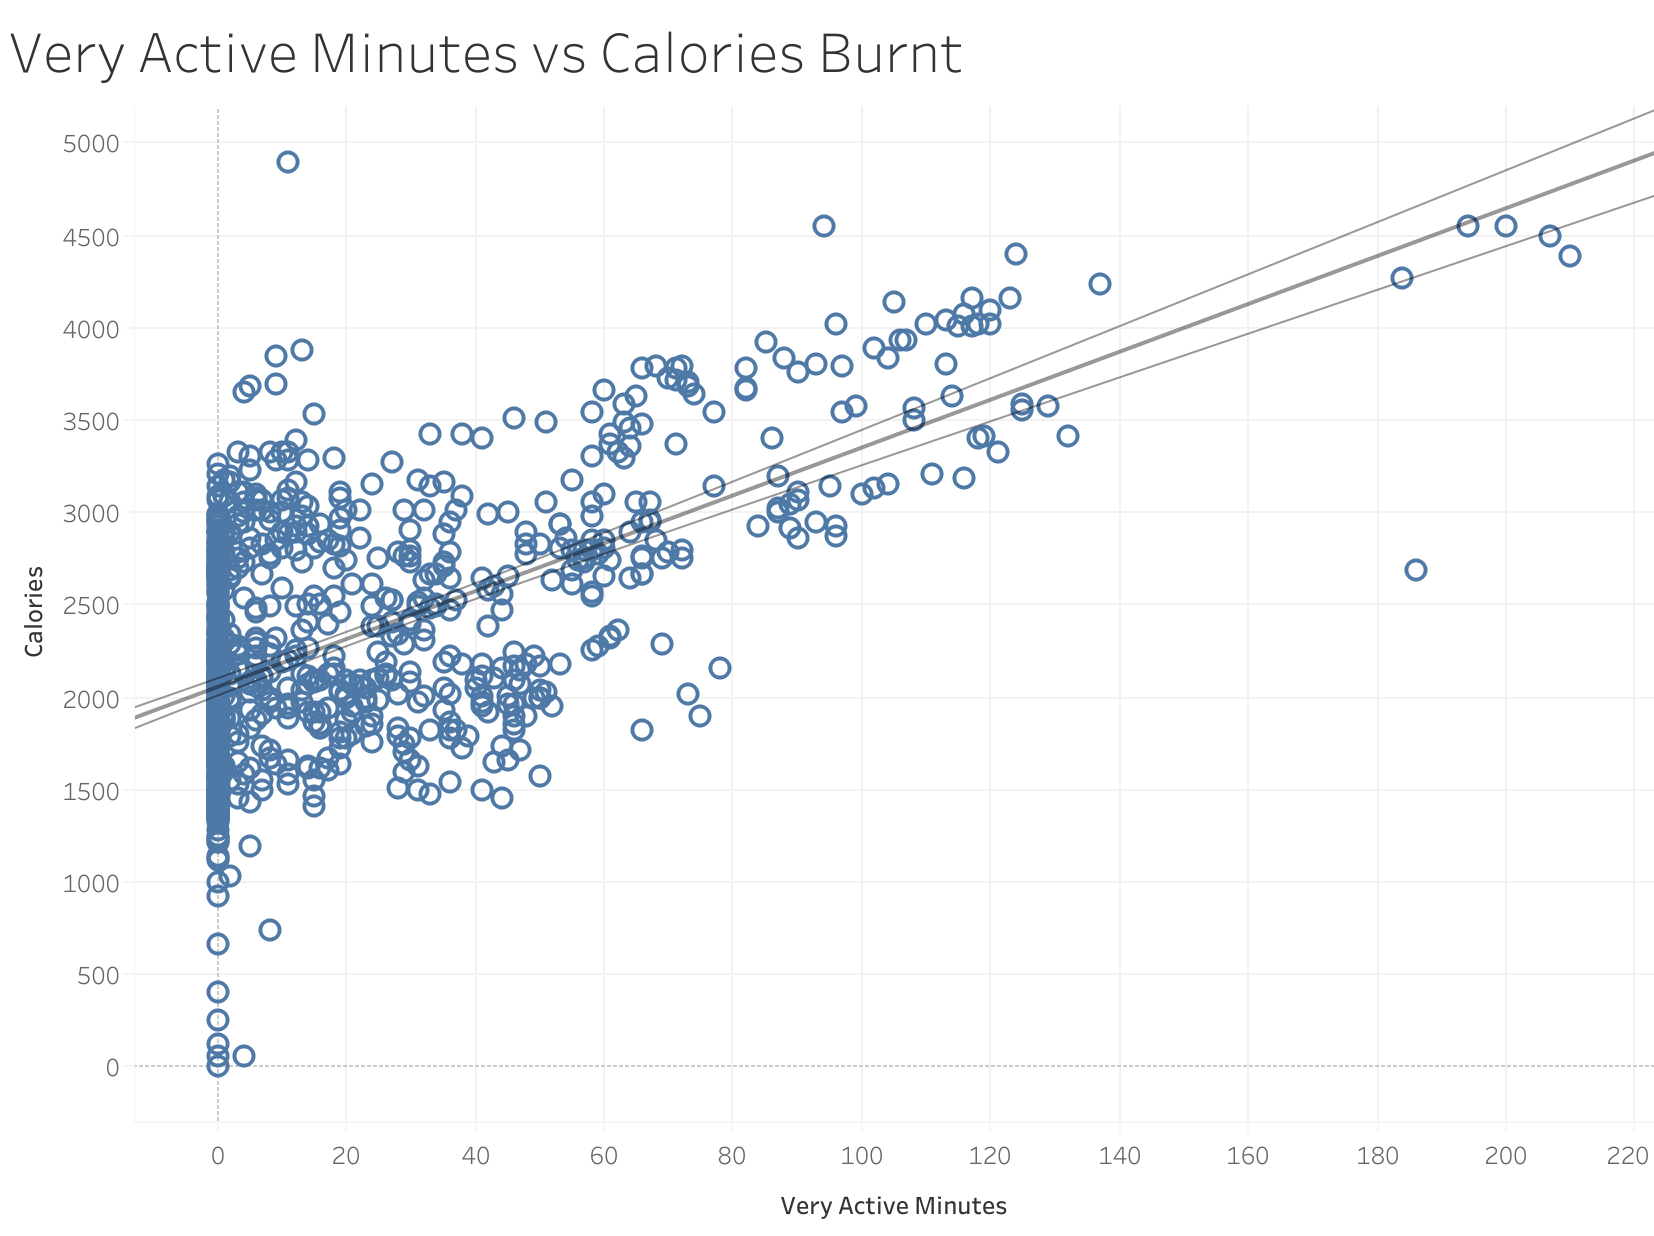
Lightly Active Minutes, Fairly Active Minutes, and Very Active Minutes vs Calories Burnt
When compairing sedentary minutes, lightly active minutes, fairly active minutes, and very active minutes to calories burnt you can see a positive upward trend as the activity increases. This trend shows that the higher the activity level the more calories are burnt.
To achieve a calorie burn around 2,000 - 3,000 calories, sedentary minutes is around 500 - 1400 minutes, lightly active minutes is around 0-400 minutes, faily active minutes is around 0-70 minutes, and very active minutes is around 0-60 minutes with a higher concentration around 0-10 minutes.
This shows that sedintary activity minutes is much higher compaired to very active minutes when looking at calories burnt.
.png)
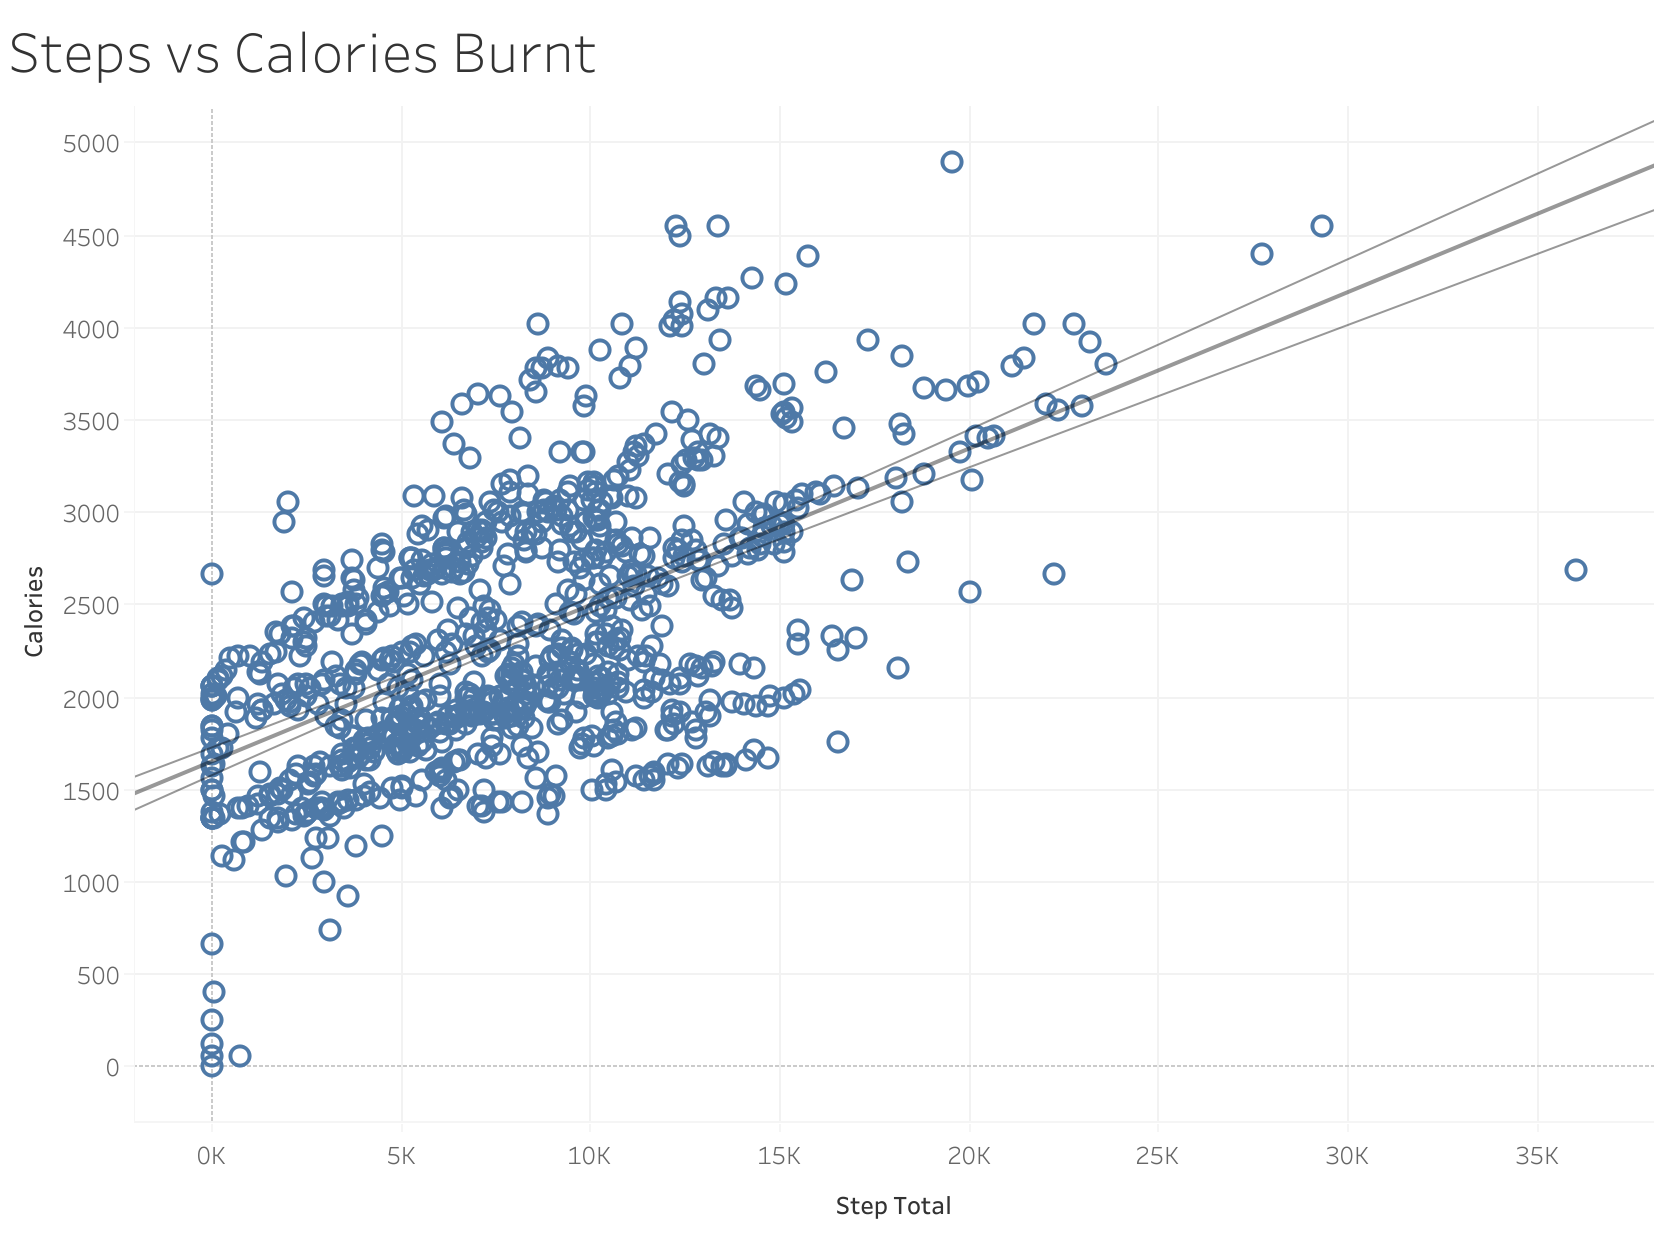
Steps vs Calories Burnt
Much like compairing activity level to calories burnt, steps vs calories burnt has a positive correlation. The amount of steps taken reflects the amount of calories burnt. As steps increase so do caloreis burnt.
Steps vs Sleep and Calories vs Sleep
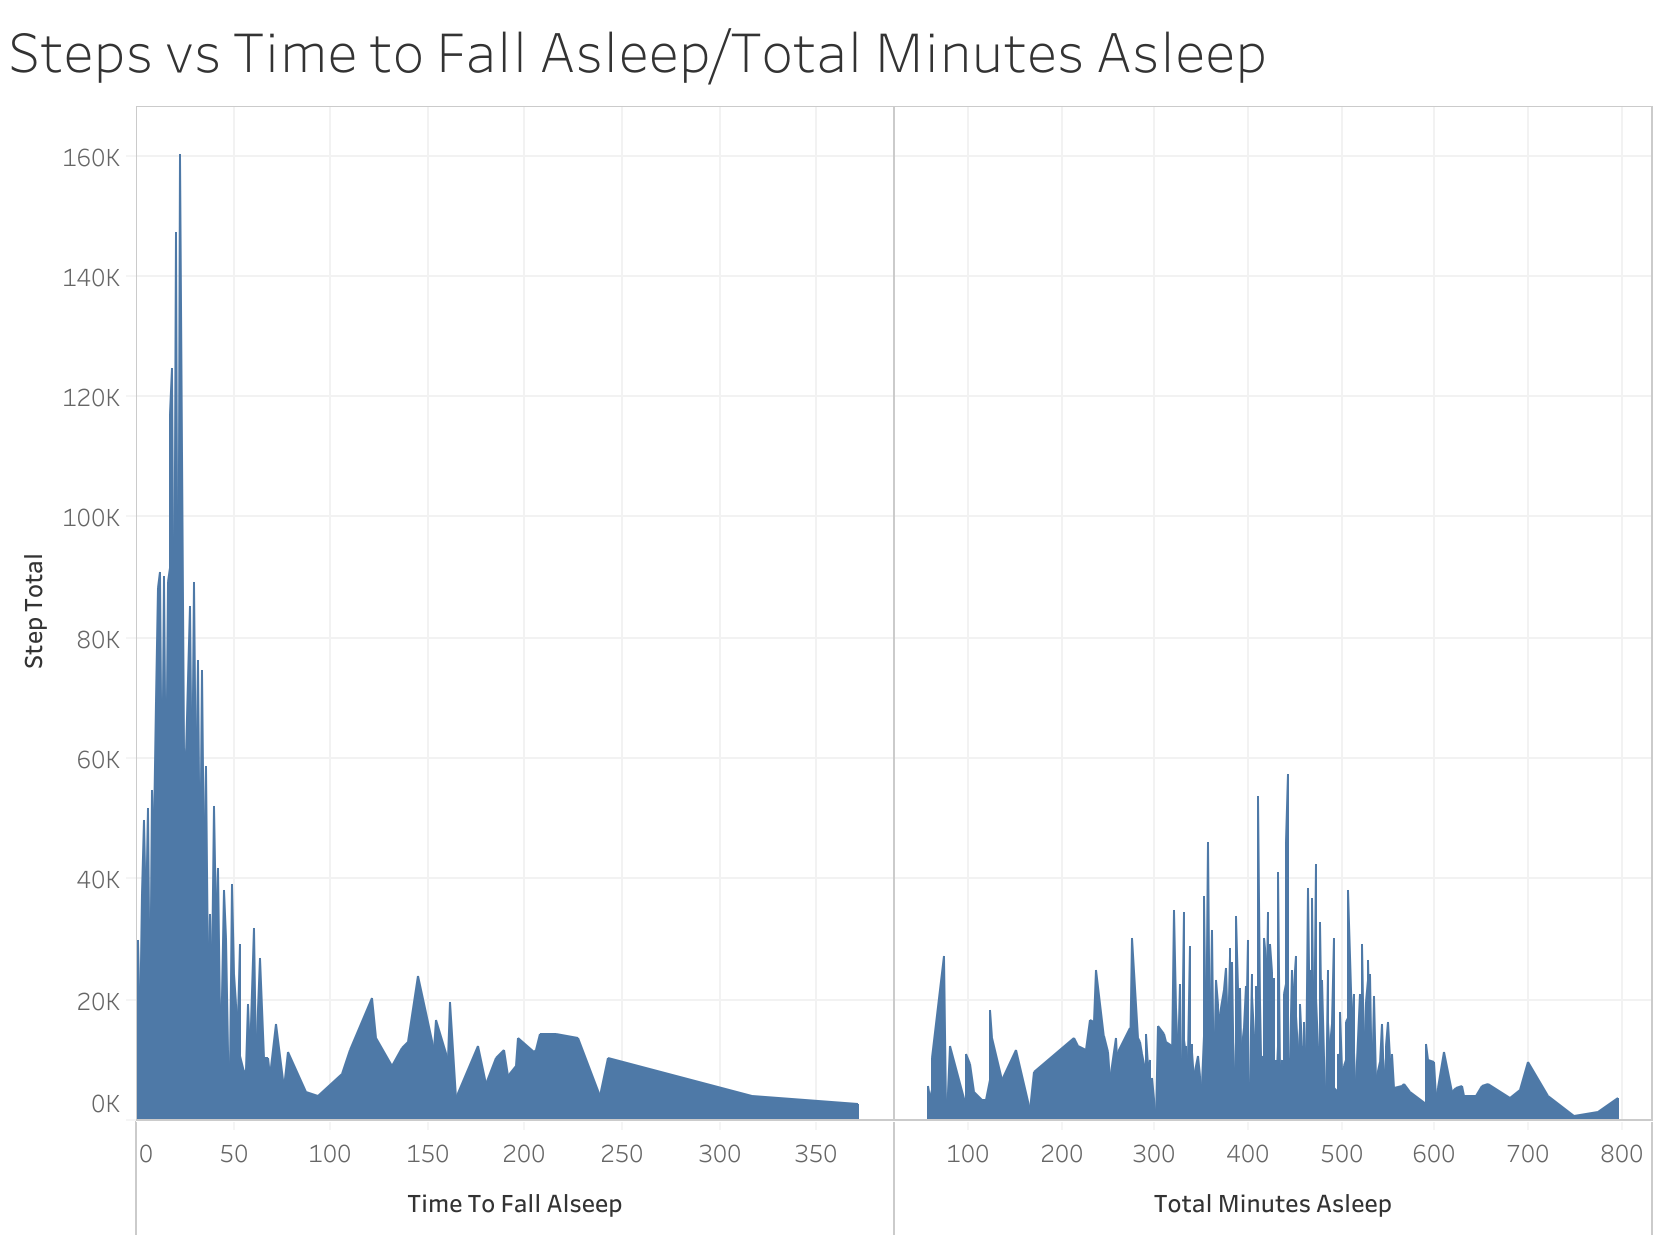
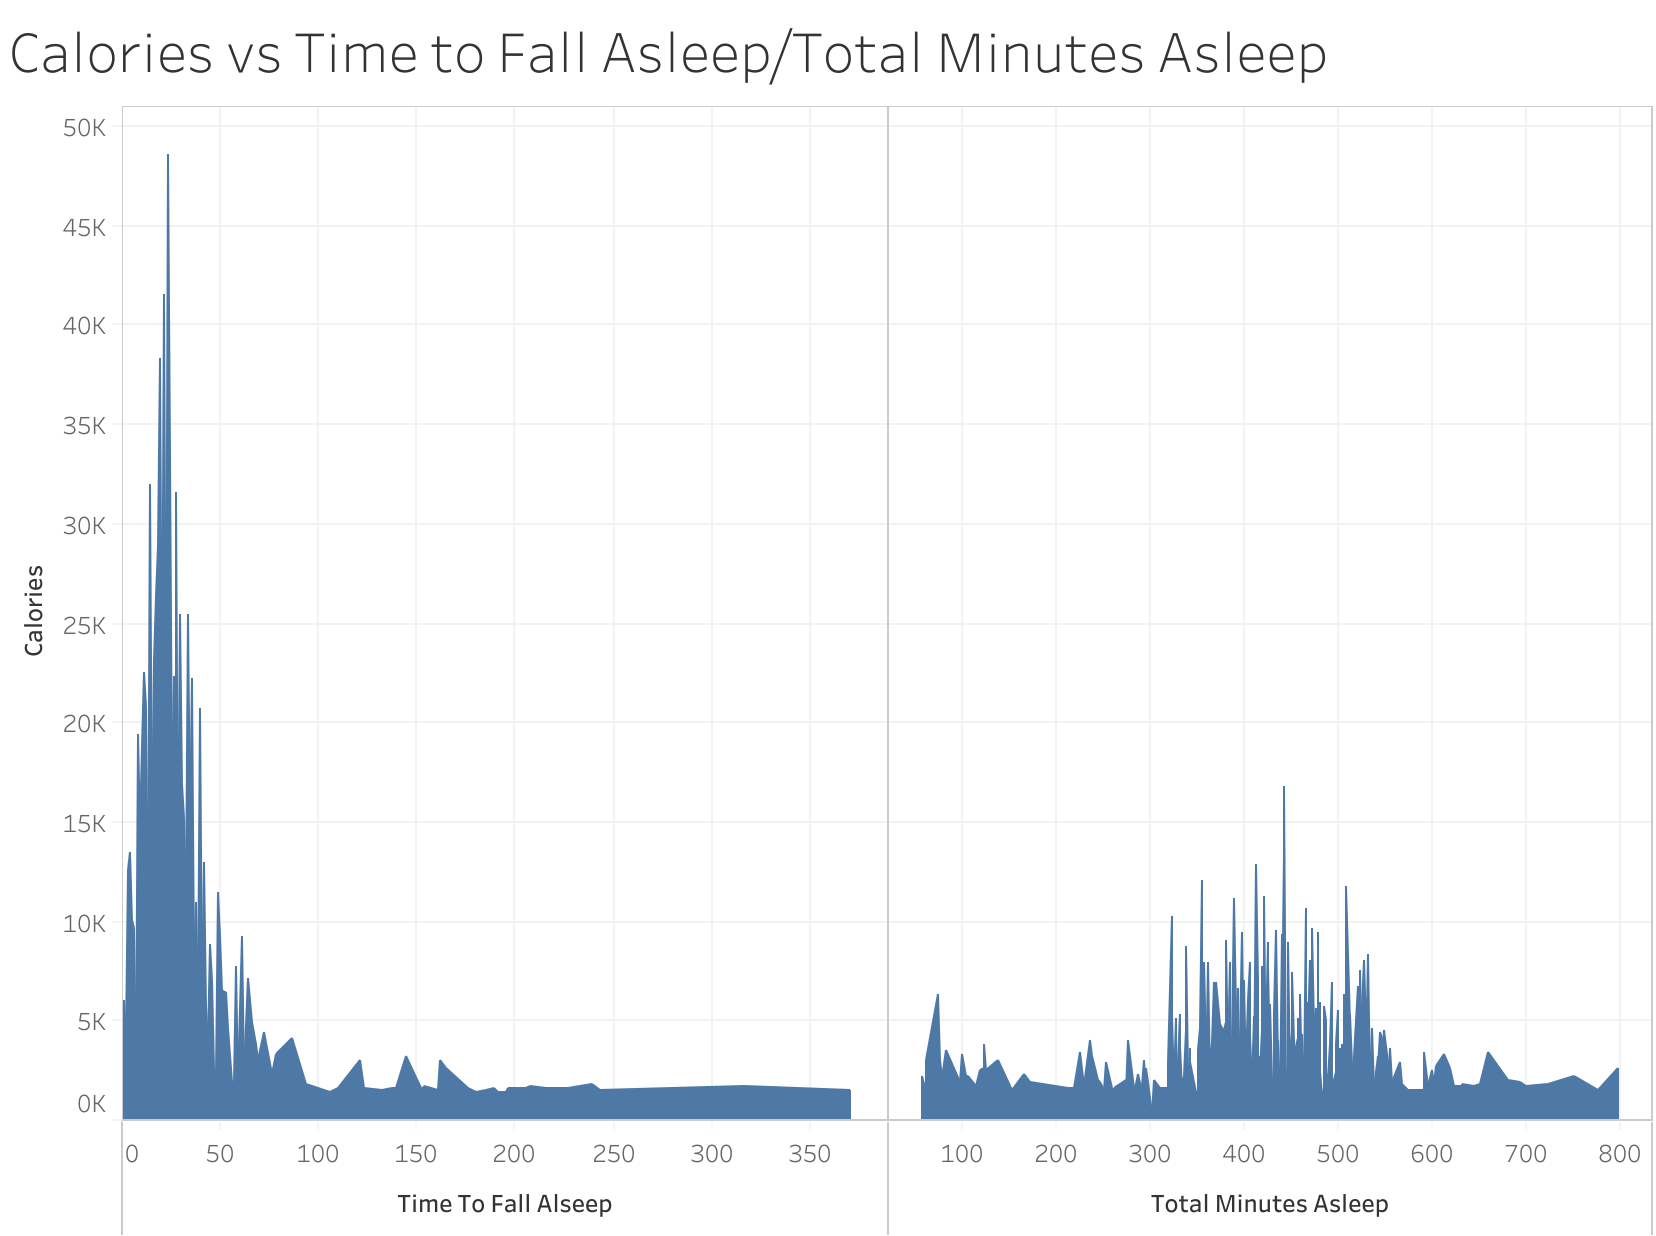
We have already seen thorugh the previous visuals that activity levels and steps has a direct correlation to the amount of calories burnt. Here we can see the affect total steps and calories burnt has on sleep.
We can see that the higher the steps and higher the calories burnt (which we know already has a relational trend) has a direct effect on time to fall asleep. Those users who have a higher step total, burn more calories, and fall asleep faster. There does not appear to be a correlation between total steps and calories burt and total minutes asleep. The total minutes asleep appear to be consistant between 300 and 550 minutes (5-9 hours) regardless of total steps and calories burnt.
Lightly Active Minutes, Fairly Active Minutes, and Very Active Minutes vs sleep
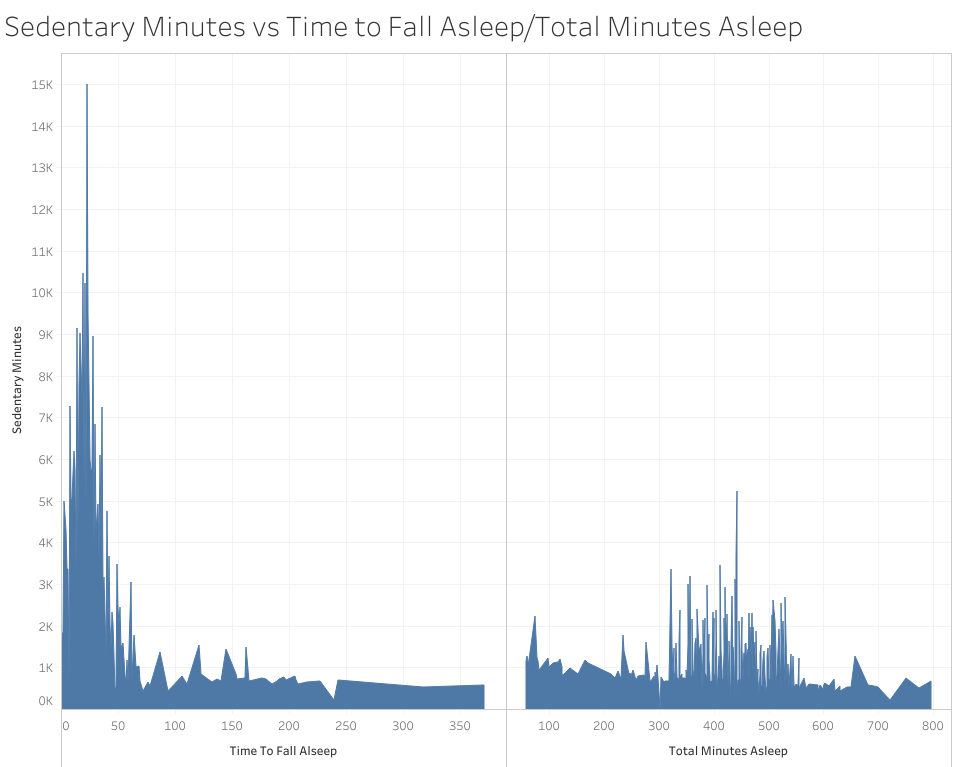
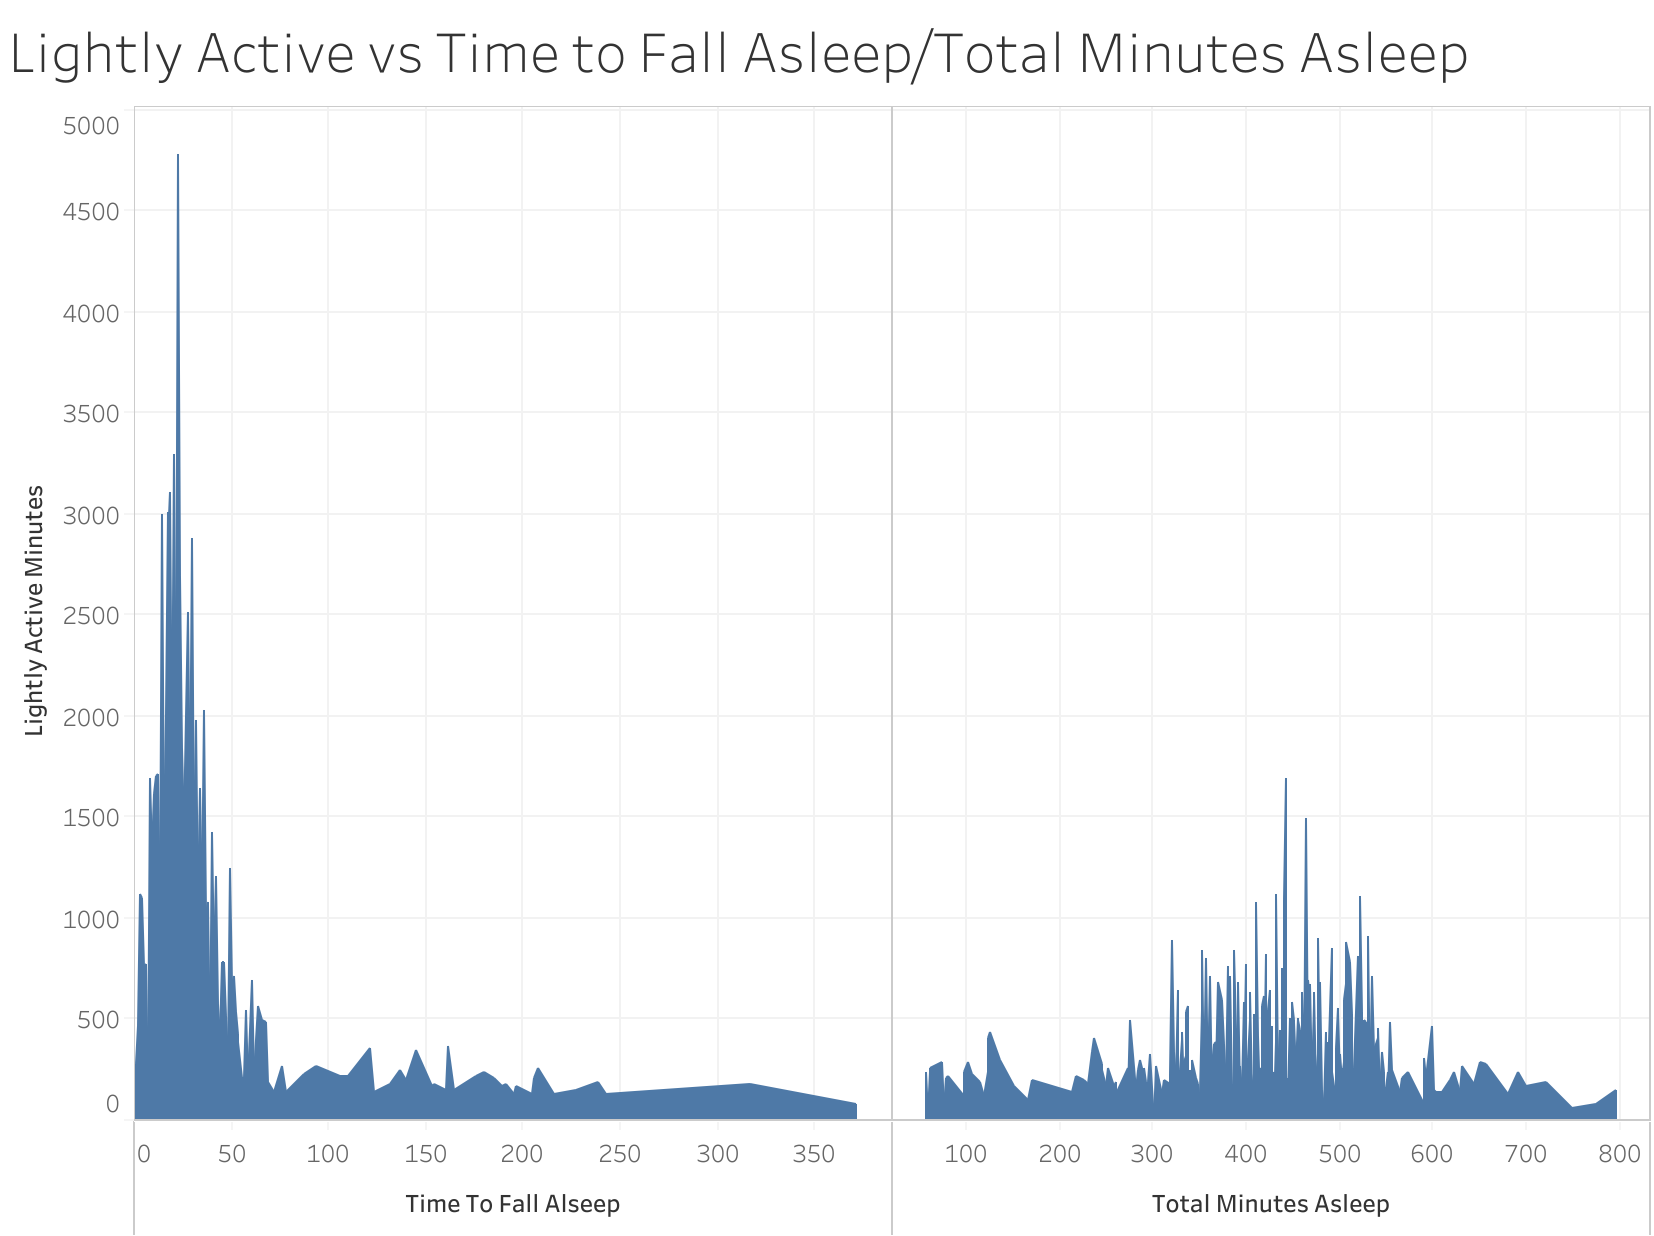
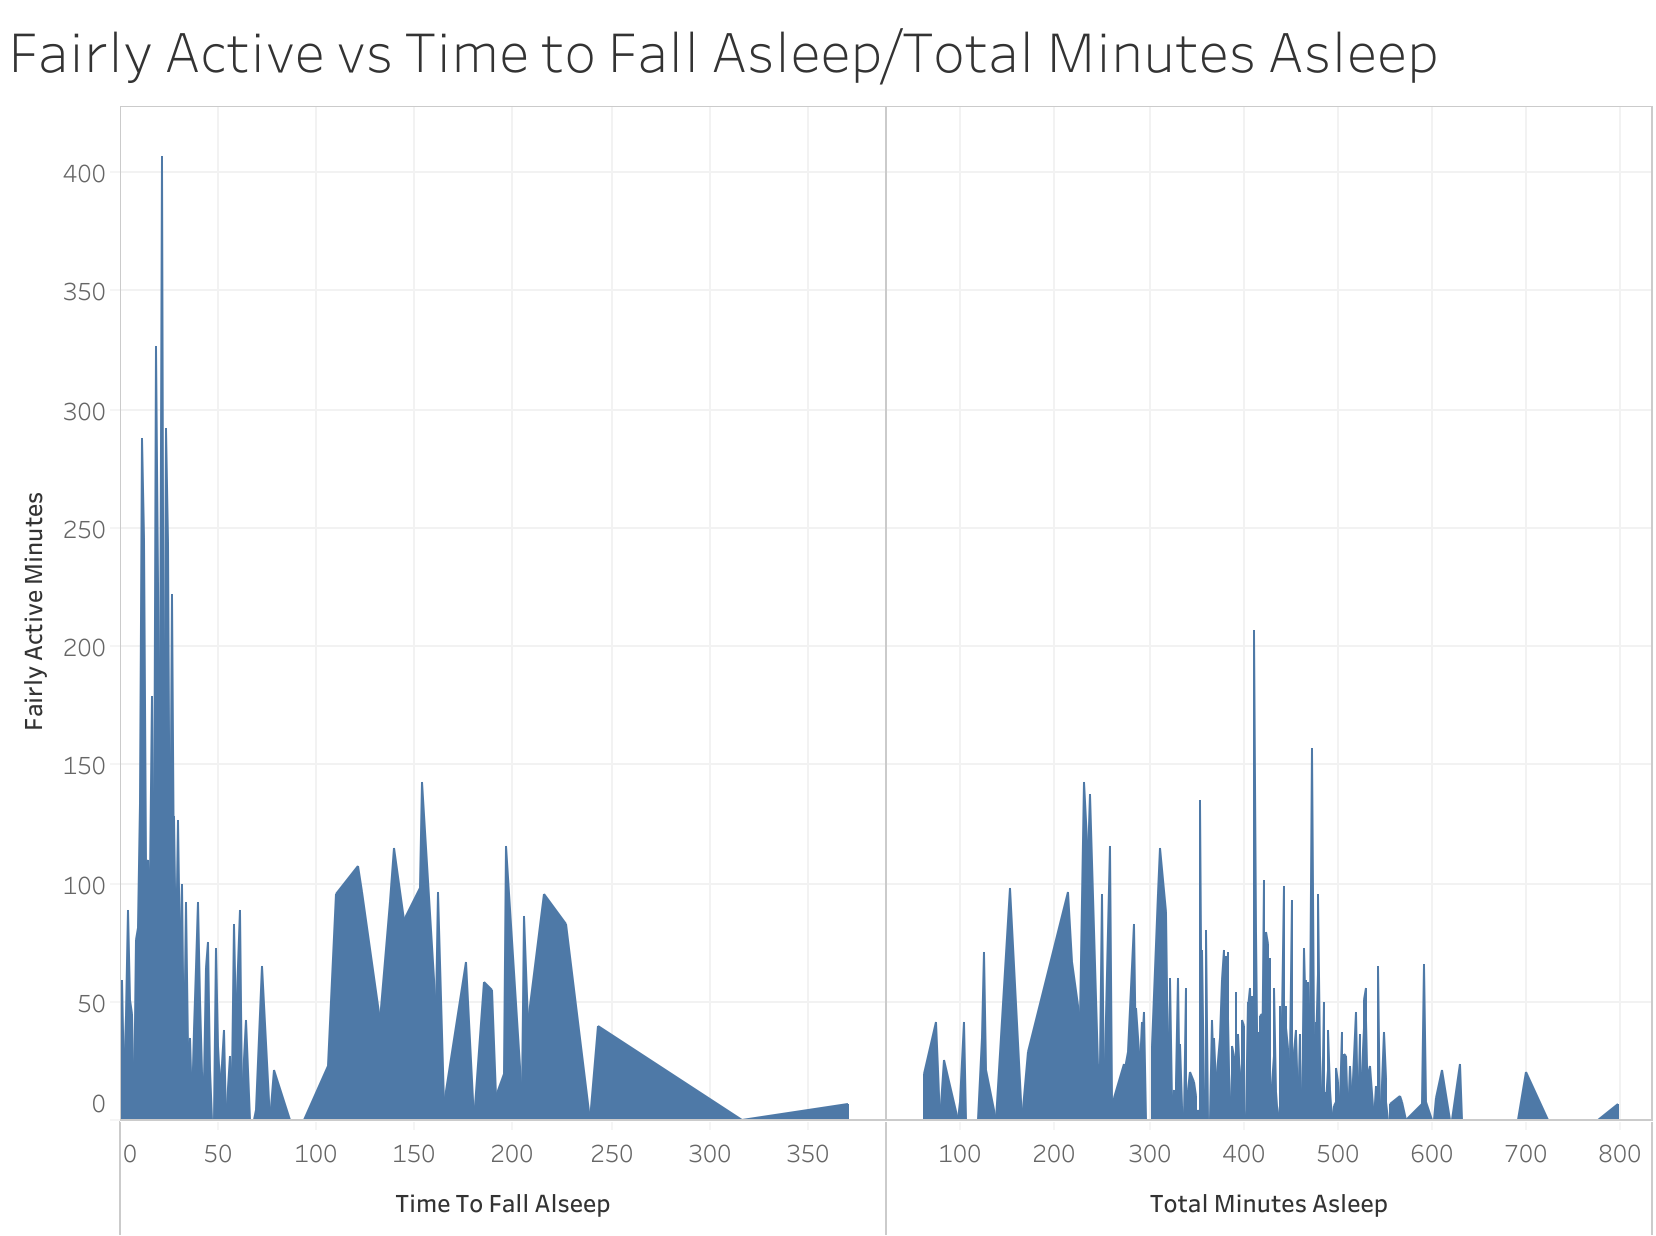
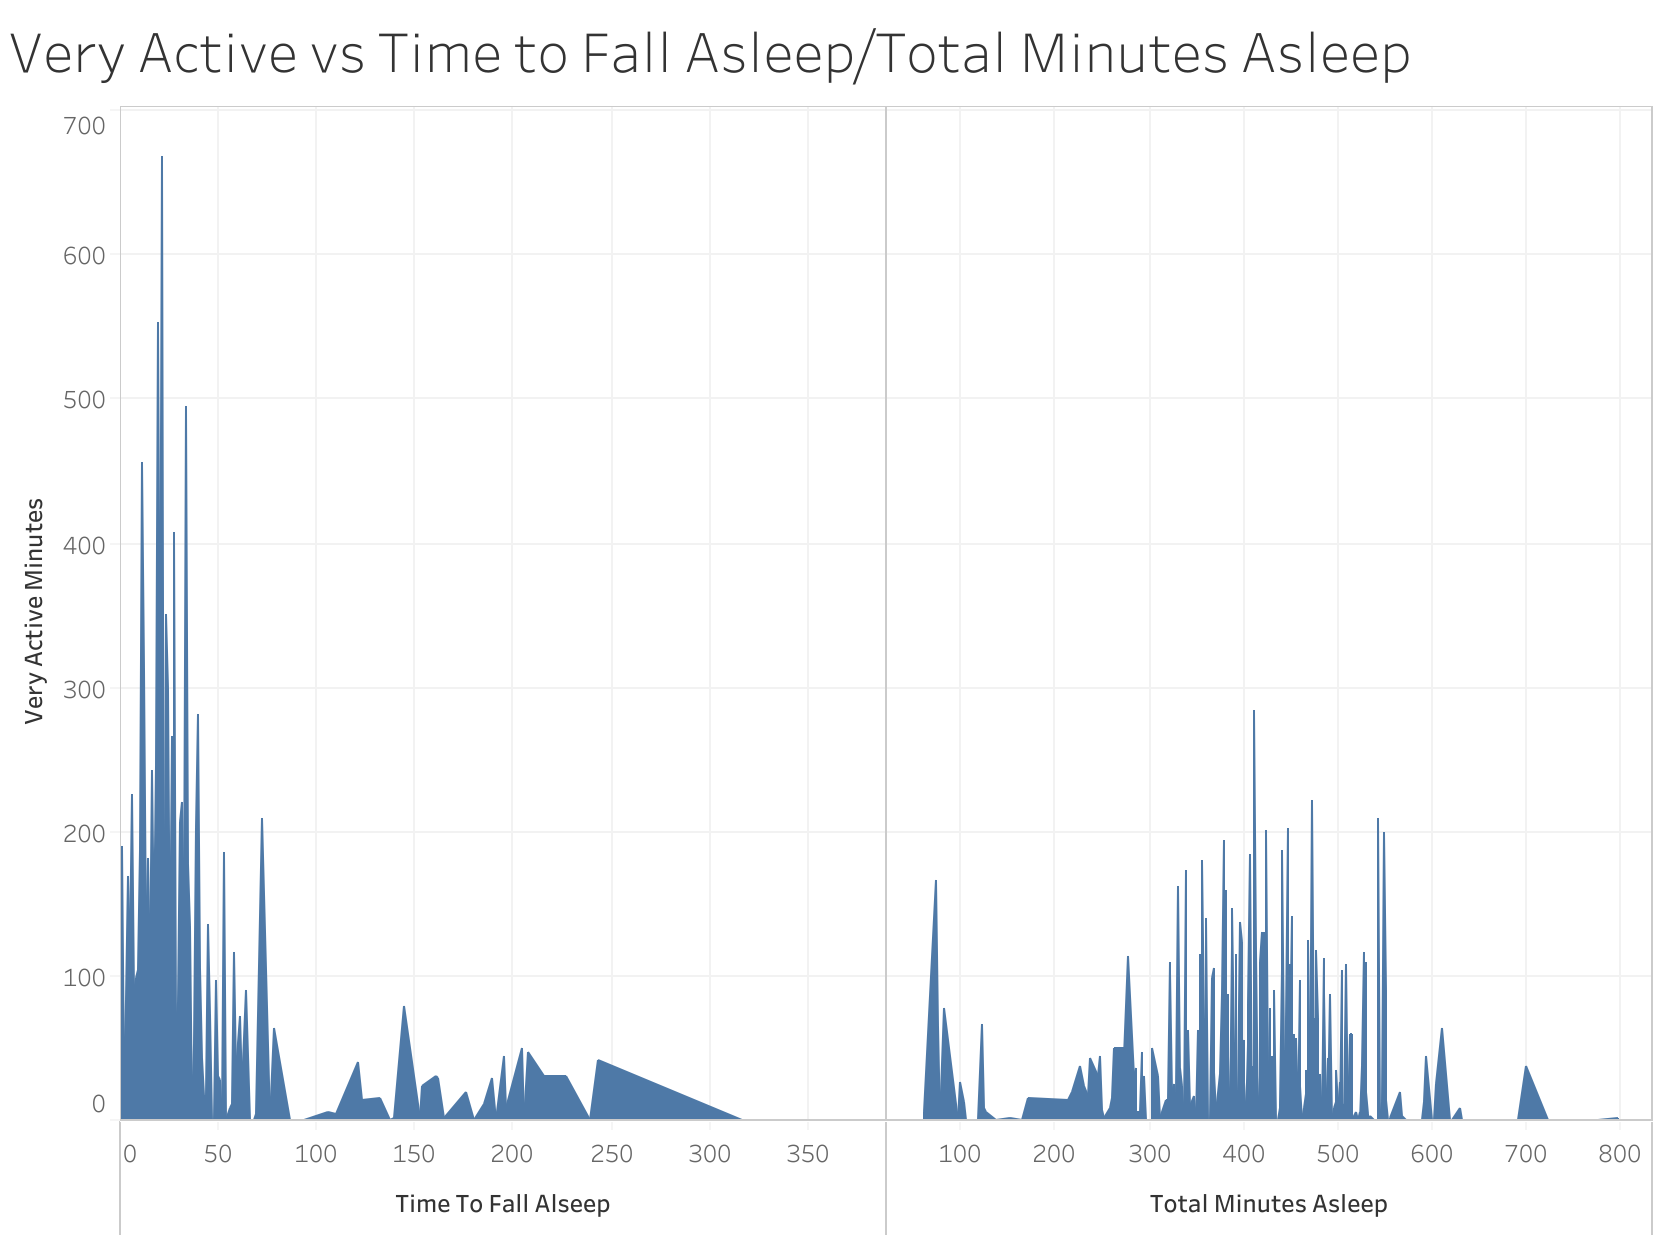
All three activity levels has very similar effects on how fast it takes to fall asleep and how much time a user is asleep. Fairly active minutes deviates from the other two and has a higher concentration of users who take longer to fall asleep and a higher concentration of users who get less sleep.
Act
Final Conclusions on Analyst
- Upon analyzing Fitbit user data visable trends can be seen. The highest level of activity is sedentary, the second highest is lightly active, and fairly active and very active activity minutes make up a small percent of total activity. Although fairly active and very active minutes of activity make up a small percent of activity, they account for the highest amout of calories burnt and account for more sleep and a faster time to fall asleep.
- It is also apparent that the more steps a user takes in a day the more calories they burn. The steps a user takes in a day also has a direct positive correlation with sleep. Users who take more steps fall asleep faster and tend to sleep longer than users who take less steps.
Recommendations for Bellabeat
It is aparenet users of Fitbit are tracking activity levels, steps, calories, and sleep the most. The analysis can be used to help Bellabeat make data-driven descisions for this products and marketing
- Bellabeat can add functionality to include an activity level point system, activity level and step achievement goals, notifications when activity is low or high, and notifications on goal completions.
- Bellabeat can also add functionality to let users set and update goals of their own based on desired steps, activity level, weight loss, and sleep.
- The Bellabeat marketing team can promote the new functionality and apply the achievement for giveaway promotions for other Bellabeat products.
